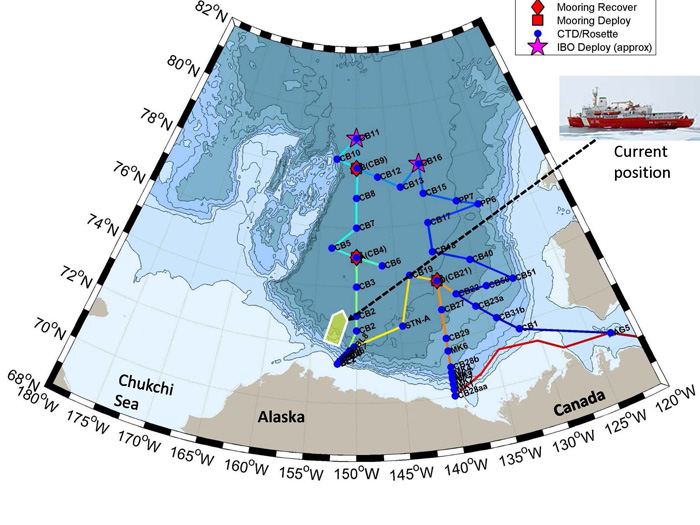


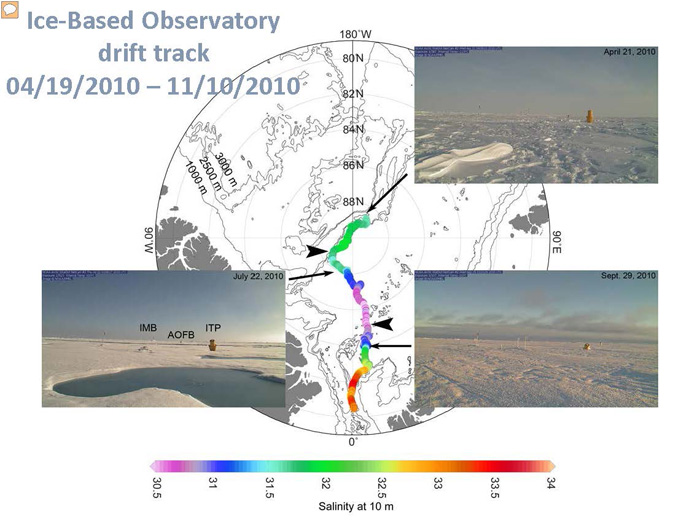
Here is a map showing the drift track and salinity at 10 m (measured by the ITP). We defined the 2010 melt season by the initiation and end of ice base ablation measured by the IMB to be between June 25 and September 7, 2010, shown by the thick arrows in the plot. Over the course of the 2010 melt season the IBO drifted about 500 km south, beginning in late June when it turned off the Lomonosov Ridge axis around 88˚N. From Timmemans et al., 2012 (see www.whoi.edu/itp references)
Text, images, graphics and other material contained on this website are subject to copyright. For more information or to license material, please contact the Director of Digital Assets, images@whoi.edu or (508) 289-2647.

The Woods Hole Oceanographic Institution is dedicated to advancing knowledge of the ocean and its connection with the Earth system through a sustained commitment to excellence in science, engineering, and education, and to the application of this knowledge to problems facing society. Learn more »


 Facebook
 Twitter
 Instagram
 Vimeo
Vimeo YouTube
 LinkedIn
 RSS Feeds


