October 1st Photos

SHARE THIS:
1. Our location.
2. Stuff on the Walls and in the Halls of the Louis.
3. Stuff on the Walls and in the Halls of the Louis.
4. Stuff on the Walls and in the Halls of the Louis.
5. Stuff on the Walls and in the Halls of the Louis.
6. Stuff on the Walls and in the Halls of the Louis.
7. Stuff on the Walls and in the Halls of the Louis.
8. Stuff on the Walls and in the Halls of the Louis.
9. Stuff on the Walls and in the Halls of the Louis.
10. Stuff on the Walls and in the Halls of the Louis.
11. Stuff on the Walls and in the Halls of the Louis.
12. Stuff on the Walls and in the Halls of the Louis.
13. Stuff on the Walls and in the Halls of the Louis.
14. Stuff on the Walls and in the Halls of the Louis.
15. Stuff on the Walls and in the Halls of the Louis.
16. Stuff on the Walls and in the Halls of the Louis.
17. Stuff on the Walls and in the Halls of the Louis.
18. Stuff on the Walls and in the Halls of the Louis.
19. Stuff on the Walls and in the Halls of the Louis.
20. Stuff on the Walls and in the Halls of the Louis.
21. Stuff on the Walls and in the Halls of the Louis.
22. 2003 expedition: first and relatively “simple” buoy was deployed. Will Ostrom, Andrey Proshutinsky and Rick Krishfield (from left to right) just finished buoy deployment (read more at www.whoi.edu/beauortgyre and go to expeditions and then to 2003 dispatches).
23. 2003 expedition: Final photo of 2003 expedition participants. You can see that some of the same people who were on board then are also on board our icebreaker now: Rick Krishfield, Celine Gueguen, and Andrey Proshutinsky.
24. Observational coverage of the BG region by CTD (red circles), XCTD (white crosses), ITPs (yellow trajectories) and moorings (A, B, C, D) in 2003-2016. Black line shows boundaries of the BG region where calculations of Fresh Water Content (FWC) were conducted. Bathymetry is shown in colors; blue arrows depict climatologic annual ice drift.
25. Hydrographic and sea ice observation before 2017 expedition: total 847 CTD casts, 978 XCTD observations; Deployed 40 and recovered 8 ITPs, deployed 20 IMBs, 21 AOFB buoys, deployed 11 and recovered 1 O-buys, deployed 50 and recovered 49 moorings. Note that we have deployed and recovered several moorings which are not part of direct BGOS program.

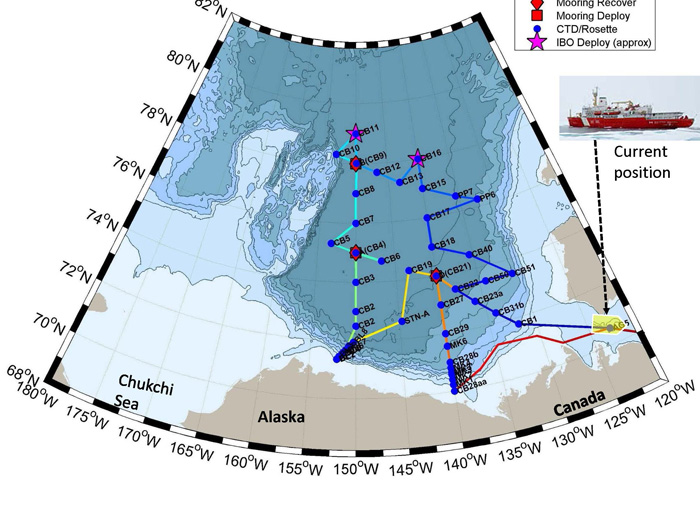
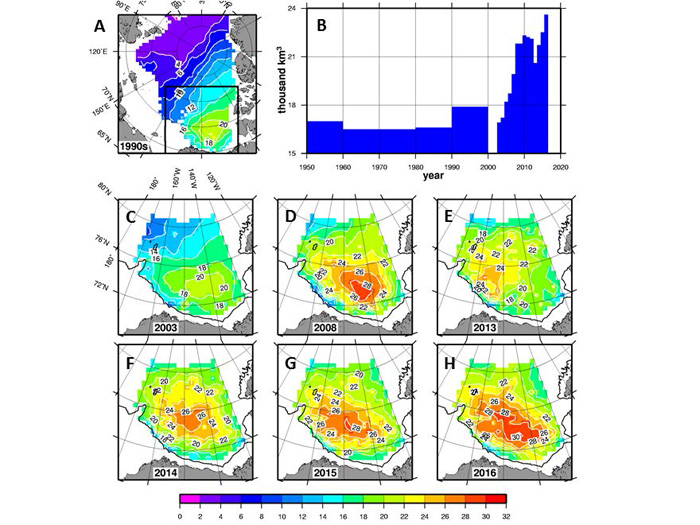
26. Dynamics of the Beaufort Gyre Fresh Water Content (FWC) since the 1990s. Panel A: BG region and FWC in the 1990s. Black box depicts BG region location. FWC (m) is shown by colors. Panel B: BG FWC time-series (thousand km3). Note that for 1950-1990, bars show decadal data but since 2003 the height of the bars indicates late summer-fall FWC in the BG region from CTDs. Panels C – H: FWC (m) distributions in 2003, 2006, 2013, 2014, 2015 and 2016, respectively.  Mean error in FWC estimation is ~0.5 m.

Image and Visual Licensing

Text, images, graphics and other material contained on this website are subject to copyright. For more information or to license material, please contact the Director of Digital Assets, images@whoi.edu or (508) 289-2647.

Explore Visual WHOI

Search multimedia database

License our Visuals