Please note: You are viewing
the unstyled version of this website. Either your browser does not support CSS
(cascading style sheets) or it has been disabled. Skip
navigation.
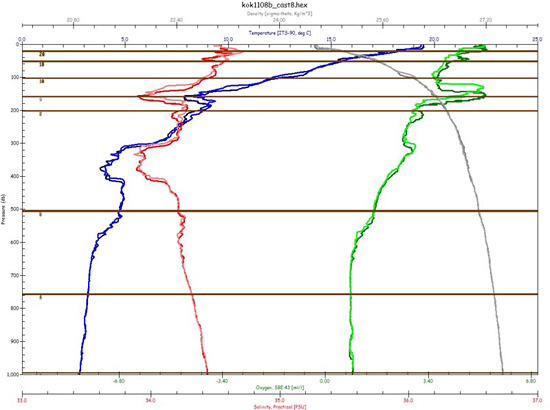
Image : June 10
Last updated: June 6, 2011 | |||
Copyright ©2007 Woods Hole Oceanographic Institution, All Rights Reserved, Privacy Policy. |

