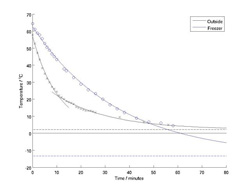
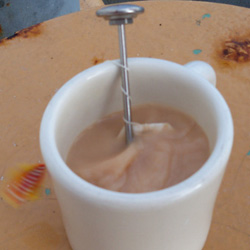
The experiment has been conducted! One cup of tea was left out on deck, with an ambient temperature of about 2 degrees centigrade, and the other was placed in a -15 degrees centigrade freezer. Both had their temperatures monitored for an hour and the graph shows the results. The measurements from the cup left outside is shown in black and those from the cup in the freezer in blue. The dashed lines show the ambient temperatures for both experiments (i.e. the temperature we would expect both cups of tea to become given enough time). I have fitted some simple exponential curves to the data, it should be that the temperature of an object which is hotter than it's environment will reduce exponentially until it reaches the temperature of it's environment. Some interesting effects can be observed. Firstly, the cup left outside cools much faster than the cup in the freezer even though the cup was in a warmer environment. This is because it was a windy day out on deck. Just as you might blow on a cup of tea to cool it, the wind cooled the tea by evaporative cooling - the energy required to free water molecules from the surface and turn them in to a gas is extracted from the heat within the tea. Evaporative cooling occurs even when there is no wind, but it is extra strong when there is wind. The cup in the freezer cools steadily following an exponential curve for most of the hour. Near the end of the experiment, the temperature of the cup becomes warmer than the fitted curve. This is because the tea is about to freeze. As the molecule in the water begin to enter the solid phase, they release the energy they had in their liquid phase in the form of latent heat. This will keep the tea at around freezing temperature until all the molecules have fused to form a block of solid tea. After this the temperature would then begin to reduce again until reaching equilibrium with the environment (in our case -15 degrees). I tried to fit a simple exponential curve to the data from the cup outside, but the cooling did not follow this curve. I had noted though, that after about 10 minutes the boat had turned and the tea had become sheltered from the wind. There's an important point here about keeping good notes of any changes in the environment whilst conducting an experiment. Also, about experiment design - it's best for your conditions to be consistent throughout, but sometimes you may not have a choice and you have to interpret your data in light of these changes. So, presuming that the rate of cooling would have changed now that we were sheltered from the cooling wind, I fitted two exponential curves, one for the period before 10 minutes and one after. As you can see the data fits the curves quite well. Before, the cup was cooling very quickly because of the wind and afterwards much more slowly. By 50 minutes, both cups had reached the same temperature and by the end of the hour, the cup outside had nearly reached equilibrium with the environment. Last updated: September 29, 2010 | ||||||||||||||||||||||
Copyright ©2007 Woods Hole Oceanographic Institution, All Rights Reserved, Privacy Policy. | ||||||||||||||||||||||