STS/ODF/Computer Resources and Marine Technicians Scripps Institution of Oceanography (La Jolla, California) supplies a team of technicians from their Shipboard Technincal Support (STS), Oceanographic Data Facility (ODF), Computer Resources and Marine Technician departments to provide the hydrographic measurements for this National Science Foundation (NSF) funded US CLIVAR cruise. This group supplies the expertise necessary to:
The Shipboard Nutrient Chemist
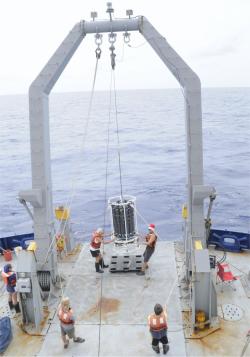
Blue water oceanography does not exist without the expertise of the hydrochemist! Onboard every vessel and each voyage there is a Hydrochemist. The role of a hydrochemist is to assist in the collection of discreet water sample from the CTD rosette and the analyses of these samples. The collection and analyses of samples by the Hydrochemistry team are typically, Dissolved Oxygen, Salinities and Nutrients.
Hi I am Mark Rayner; I am employed by the Commonwealth Scientific Industrial Research Organisation. (CSIRO) Australia. I am onboard the RV Melville as a part of the Hydrochemistry team that provide other researchers onboard with chemical data. My role onboard is to carry out the nutrient analysis.
Nutrients are the oceans’ building block of life, essential to all life cycles that occur in the ocean. Nutrients are consumed by lower plant form such as algae which in turn are consumed by organisms further up the food chain, so it is a bit like who eats who in the zoo, so to speak!
We have established that nutrients are an integral part of the ocean systems; they affect productivity, bio diversity, and in the deep ocean nutrients are used to identify particular water masses, like the Antarctic bottom water.
The Hydrochemistry team analyses 4 nutrients simultaneously; these are: silicate, nitrate, nitrite and phosphate. The nutrient analyses involve a Technicon Auto Analyser II. This is a segmented flow system that creates small seawater sample packages segmented by air, using a peristaltic pump. This pump provides a constant non surging flow. The addition of .colour forming reagent reacts with the specific nutrient forming a colour. The colour intensity is proportional to concentration of the particular nutrient. The intensity of the colour is measured by simple colorimeters. The colorimeter consists of a box, about the size of a shoes box. It contains a light source, a specific wavelength filter and a phototube. From this we can obtain a voltage response and are able to calculate the nutrient concentrations for each individual sample.
On our way to Tahiti the Hydrochemistry team will analyses some where in the order of 5500 nutrient samples!
Mark Rayner CFC's: University of Miami/RSMAS DIC: AOML and PMEL TALK/pH: University of Miami/RSMAS DOM: University of California, Santa Barbara He/Trit: Woods Hole Oceanographic Institution
The trace metals group consists of Chris, a professor at the University of Hawaii, his Post Doc Bill and student Max, and a volunteer, a recent graduate from UNH, Jack. Their participation in the CLIVAR P6 cruise is part of the first effort to look at the global distribution of dissolved trace metals, specifically aluminium (British for aluminum) and iron, in the top 1000 meters of the world’s oceans. Chris developed two of the methods that are being used on this cruise to analyze seawater to detect trace metals, and now, CLIVAR is providing a platform from which this group can survey the upper ocean distribution of several trace metals.
Some trace metals come from airborne dust that is deposited into the surface ocean, often by precipitation. Aluminium is one of these and as such its distribution can be used as a tracer of this terrestrial dust input. Its geographical distribution therefore is an indicator of where iron, another element that has an atmospheric supply route, is being added to the surface ocean. It is important to understand the distribution of Iron because this element is necessary for primary production in the oceans and is, in several areas, the limiting factor in oceanic biological productivity. Incorporating iron distributions into global climate models is important since by limiting oceanic primary production its availability can affect the uptake of atmospheric carbon dioxide by the ocean. However, there is currently little data available on the availability of iron in surface waters and most of the global estimates of dust deposition that brings iron to the ocean are based upon models that have not been ground-truthed. Chris’ group is not only providing a database of dissolved trace metal distribution on a global scale; it is also helping to constrain the accuracies of these current models.
A project like this had not been previously attempted for a number of reasons. First, it was widely believed that high resolution sampling by rosette without contamination would be impossible. Second, previous to CLIVAR and its predecessor WOCE there were no systematic programs from which to sample for trace metals on a global scale. Finally, methods for detecting trace metals rapidly and at sea needed to be developed. CDOM: University of California, Santa Barbara Colored Dissolved Organic Matter (CDOM) and Dissolved Organic Carbon (DOC) Most people in the world will agree that the color of ocean water is primarily blue. Along coastlines, however, sea water can appear in shades of green, yellow, or even brown. Even in the open ocean satellites can detect subtle changes in ocean color invisible to the naked eye. The color of sea water depends on many constituents such as sediments, phytoplankton and colored dissolved organic matter. Pure sea water that is free of these constituents allows blue wavelengths of light to penetrate deeply into the water column making it appear blue. Chantal and Rachel of UC-Santa Barbara study the organic consitutents that give seawater its color and relate the properties of organics to the global carbon cycle. Sediments delivered to the ocean from continental runoff can scatter light to give it a brown to reddish color. Sediments also deliver important trace metals, such as iron, to the ocean to improve rates of photosynthesis. Phytoplankton are small, single celled organisms that produce their own food using a pigment commonly known as chlorophyll. Chlorophyll is what gives ocean water its green color. Phytoplankton utilize carbon dioxide during photosynthesis, drawing this important greenhouse gas out of the atmosphere and storing it in the ocean. Colored Dissolved Organic Matter (CDOM) is an optically observable property of sea water produced when bacteria breakdown phytoplankton into pigment fragments, amino acids, and other organic molecules. CDOM absorbs light to produce a yellowish ocean color. CDOM was once thought to be important only in coastal regions. New technology has revealed that patterns of CDOM abundance are also observable in the open ocean. CDOM is an important sea water property to study for several reasons. Most importantly, CDOM absorbs in the UV light spectrum (250-480nm), acting as a ‘sunscreen’ for organisms living in the photic zone of the open ocean. Along coastlines, very high levels of CDOM diminish light penetration in sea water and can have an inhibitive effect on photosynthesis. Very high levels of CDOM may reduced phytoplankton productivity, and over long time scales impact the absorption of carbon dioxide from the atmosphere into the ocean. CDOM and phytoplankton absorption overlaps at 440nm-480nm, making interpretation of remotely sensed satellite data difficult. Ground observations of both CDOM and phytoplankton in the open ocean are very important to improving the algorithms used to translate satellite data into CDOM and phytoplankton abundances. Dissolved Organic Carbon (DOC) is a broad classification of any organic molecules found in sea water. DOC is one of the world’s largest carbon reservoirs that sequesters carbon from the atmosphere into the ocean, similar in magnitude and importance to the terrestrial carbon reservoir. Understanding abundance and fluxes of DOC in the ocean is critical to constraining the global carbon budget. On the CLIVAR P6 cruise several properties of sea water are measured to improve our understanding of CDOM and DOC and their role in the carbon cycle. CDOM itself is measured in water samples collected at discrete depths on the rosette are filtered through 0.2 micron filters and a long pathlength (2m) spectrophotometer is used to determine how much light in the 250-750nm spectral range is absorbed. Dissolved organic carbon (DOC) is measured using high temperature catalytic combustion. While CDOM is not correlated with DOC, both properties can reveal important patterns in carbon export and transport. Chlorophyll is measured by filtering 250 ml of sea water through a 0.45µm filter its fluorescence measured using a standard fluorometer. Bacteria samples are analyzed using flow cytometry, which measures the abundance of bacteria and viruses in three size groups. Bacterial abundances are especially relevant to CDOM studies because CDOM is produced through bacterial activity. Data collected on this cruise can be compared to satellite measurements to improve our understanding of the carbon cycle in the South Pacific Ocean. Previous CLIVAR surveys have found that CDOM is strongly correlated to apparent oxygen utilization (AOU) in the North Pacific and North Indian Oceans. In these oceanic regions, rates of deep water formation are very slow so it takes a long time for oxygen rich surface waters to mix with oxygen poor bottom waters. CDOM accumulation through remineralization by bacteria is therefore highly observable. CDOM is therefore a potentially important proxy for remineralization rates and water mass transport rates in the North Pacific and Indian Oceans. In well-mixed oceanic regions, such as the North Atlantic and Southern Ocean, the relationship between CDOM and AOU falls apart because oxygen-rich surface waters mix rapidly with bottom waters during deep water formation. LADCP: University of Hawaii Last updated: December 31, 2009 | ||||||||||||||
Copyright ©2007 Woods Hole Oceanographic Institution, All Rights Reserved, Privacy Policy. | ||||||||||||||