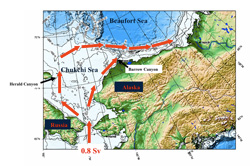
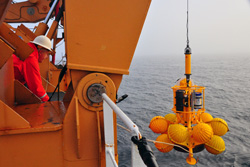
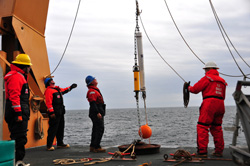
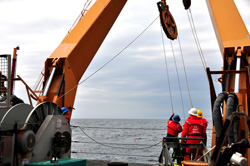
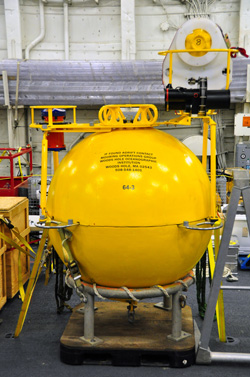
September 11th“Henry Stommel, the most original and important physical oceanographer of all time,” wrote his friend and former student Carl Wunsch, “entered oceanography [1944] when the field still had the atmosphere of an avocation for wealthy amateurs who used their own yachts for research; he left it at a time [1992] when it had been transformed into a modern branch of science.” Oceanography is a young science because of the brute difficulty of measuring its subject. Most science proceeds from measurements, from collected data. But oceans cover some 71% of Earth’s surface—and the oceans’ surfaces don’t always cooperate. The average depth of the Atlantic is 12,000 feet, the Pacific deeper still. Below about 300 feet, no light penetrates the depths. Also oceans don’t sit still have their temperatures taken; they move and change constantly on all timescales. How do you measure a thing like that? Though some brilliant theoretical foundation was being laid before World War II, particularly by Scandinavians (Ekman, Sverdrup, Nansen), there were few oceanographic tools more sophisticated than a bucket, a thermometer, and notes in a bottle. But the War and the cold one that followed without intermission revolutionized oceanogrpahy, when radar, sonar, electronic navigation devices, and other legacies of strife passed into oceanographers’ peaceable hands. In fact, many of the acoustic tools aboard Healy right now were originally conceived to hide our submarines and to kill theirs. The sort of oceanography going on aboard this ship is a unique amalgam of pure science, heavy industry, gee-whiz engineering, and first class seamanship. The highly specialized research ship itself is the most fundamental oceanographic tool—first you need to get out here. This afternoon we’ll be treated to a guided tour of Healy so let’s wait to discuss her particulars and her adaptations for ocean research. Remember we stressed that ocean currents constantly change their velocity and, within limits, their direction? Therefore, you can’t measure a current only once and assume you’ve got it. Oceanographers have cleverly accommodated this and other inconvenient facts of life by inventing a range of tools, in fact too many to discuss at one time, so let’s start with the mooring. The foundation of a mooring is the anchor and the top float with a length of wire in between on which scientists attach a variety of instruments appropriate to their objectives. A huge benefit of the mooring is that it can be left in the water for a year or more measuring the water column vertically from near the bottom to near the surface. But because they’re anchored they’re able to measure only one point in the current. Therefore, Dr. Bob must decide long before the cruise begins the most productive points to plant his moorings. The sort of oceanography going on aboard this ship is a unique amalgam of pure science, heavy industry, gee-whiz engineering, and first class seamanship. After the northward flow of cold, salty Pacific water clears the Bering Strait northbound, it temporarily splits, due to “bathymetric steering,” into two branches. One bends northwest through the Herald Canyon into the Chukchi Sea. Meanwhile, the other hugs the northwest Alaskan coast, thence flowing northeast through the Barrow Canyon. At a point roughly north of Barrow, the two arms rejoin to form Bob’s Western Arctic Boundary Current, which then proceeds eastward along the shelf break (where the shelf dives into deep water). Bob has chosen a point in that eastward flow (152 degrees W longitude) to place one of his most important moorings. In some ways it’s typical, and in others it’s special. Between the bottom, at 150 m and the top float 40 m below the surface, a relatively new device, the moored profiler, is at work. It’s a pod of sensors to measure temperature, salinity, and nitrates that, powered by a little traction motor, chugs up and down the wire at a fixed rate measuring away and automatically recording its findings. Dr. Bob is an Arctic specialist. Ice is a fact of his professional life. Ice destroys instruments; he’d like to stay as far away from it as possible, but he can’t and still do oceanography in the Arctic, where ice is an essence of the environment. Remember, we said that the top float must remain some 40 m below the surface to protect it from, among other dangers, drifting sea ice? A lot of important, tantalizing stuff goes on in that near-surface (near-ice) water between the top float and the surface. But how to measure it without losing your equipment and its data? Bob had been pondering that question for some time. So he carried the problem to the justly famous engineers at Woods Hole Oceanographic Institution, and together they came up with a brand new oceanographic instrument: the Arctic Winch. A small buoyant package of instruments containing the same sensors as that moored Profiler is mounted on top of the top float. Once a day the package is released and allowed to rise on a tether either to the surface or to the bottom of the ice pack as the case may be. If the package hits the ice, the tether will go slack, and that signals the winch to wind the instrument back down out of harm’s way. The really clever wrinkle is that before each deployment the instrument runs a self-check for battery power. If the power’s too low, the instrument doesn’t go. Further, at the end of each round trip, data are sent to a built-in recorder, thus ensuring that at least some data will be preserved should the package come to grief in the ice. We throw around the names of these and other oceanographic tools as common fizzo parlance, sometimes taking them for granted. But every now and then it’s worth pausing to remember that they are brilliant and creative engineering solutions to unique ocean-science problems. And watching the apparent ease with which highly skilled guys like John and his team actually deploy the moorings, one tends to forget just what complex and somewhat dangerous work it really is. All of these sharp people—engineers, technicians, scientists, and ship handlers—are absolutely essential to accomplish this work, because of that inherent brute difficulty of measuring an ocean. Hydrophone mooring deployment from Benjamin Harden on Vimeo. Last updated: September 28, 2010 | ||||||||||||||||||||||||||
Copyright ©2007 Woods Hole Oceanographic Institution, All Rights Reserved, Privacy Policy. | ||||||||||||||||||||||||||