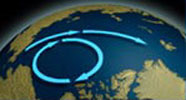
Bill WilliamsOctober 16, 2014I’d like to say a big thank-you for the big effort this year from the science team and from the Captain and crew of the CCGS Louis S. St-Laurent. The mission is successful and well done, and done in the face of winter freeze-up and rapidly shortening daylight hours. When running this expedition everything depends on the ice conditions. Open water means that the ship steams very quickly and easily but waves may make our work difficult. Ice cover dampens the waves buts slows our transit. Fortunately, we have been lucky with the ice this time: ice in the north and east was known to be made of large, multi-year ice floes, but, by the time we arrived there, these floes were pushed southward by the north wind and a maze of leads had opened-up between them. This is highlighted on this RADARSAT image from the Canadian Ice Service website. We completed the last part of our expedition by ‘wriggling’ between the floes, and you can see this in our cruise track. The data collected this year forms our 12th annual ’snapshot’ of the Beaufort Gyre, and includes 40 CTD/Rosette casts, 65 eXpendible CTDs, 3 mooring recoveries, 5 mooring deployments, 2 Ice-Based Observatories and 3 Ice Tethered Profiler recoveries. That’s a lot of high quality data, and they provide coverage of the Gyre for this September-October and link current conditions to last year via the Beaufort Gyre Observing System mooring and Ice Tethered Profiler data. There is nearly always a large change from one year to the next in the Arctic and this year was no exception to that. We measured a sharp increase in the freshwater content of the Beaufort Gyre this year, in comparison to last year. Analysis of the data, after we return home, will show how this came about, and determine the contributions of the increase from sea-ice melt and Arctic rivers. Thanks again, Bill Williams. Last updated: October 7, 2019 | |||||||||||||||||
Copyright ©2007 Woods Hole Oceanographic Institution, All Rights Reserved, Privacy Policy. | |||||||||||||||||


