Please note: You are viewing
the unstyled version of this website. Either your browser does not support CSS
(cascading style sheets) or it has been disabled. Skip
navigation.

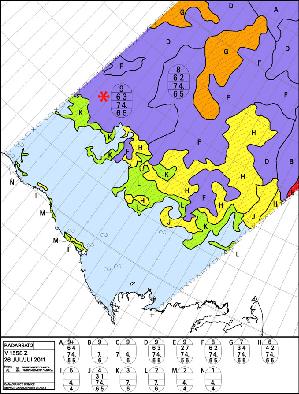
Dr. Mary-Louise TimmermansJuly 27, 2011We made it to the edge of the multi-year ice pack today and were met with high ice concentrations on our way to science "Station A" (at 72.5 N, 144.5 W). The ship has a number of navigational aids for operating in ice-covered waters, all of which were in use. High-resolution images from the Canadian Radar Satellite (RADARSAT) are available daily to aid in the identification of different ice types and examine regional sea-ice concentration. Daily ice charts are also provided by the Canadian Ice Service (CIS); these are produced using satellite images and observations from the Canadian government's Ice Patrol that makes regular ice reconnaissance flights. The ship's radar is an additional valuable tool for assessing ice conditions over a range of a few miles. Ship operations in sea ice are a busy time for the Ice Observer (or "ice pick") Roger Provost who uses the combination of data from these sources as well as observations during helicopter reconnaissance to produce detailed charts of sea-ice conditions in the vicinity of the ship. Today, Helicopter Pilot Christopher Swannell flew Roger, Alice Orlich (UAF) and Jeffery Nguyen (US Naval Academy) on reconnaissance to assess the ice pack en route to science Station A. During the flight, Roger scanned the ice conditions from the helicopter and entered them immediately on a portable tablet PC. Back on the ship, he produced a chart to report to the Captain who used this information to decide on the best route through the ice pack. According to the National Snow and Ice Data Center (www.nsidc.org), sea-ice extent over the entire Arctic Ocean declined more rapidly in the first half of July than compared to other recent years. With the September sea-ice extent minimum still 1.5 months away, it is too early to tell whether we'll see an ice extent as low as the satellite-record minimum extent in 2007. Last updated: October 7, 2019 | ||||||||||||||||||||
Copyright ©2007 Woods Hole Oceanographic Institution, All Rights Reserved, Privacy Policy. | ||||||||||||||||||||