
Gerty WardAugust 9, 2008The most common three-letter abbreviation in oceanography is CTD. Measuring these parameters of ocean water establishes the layers of the ocean water sandwich. In order to understand the questions being asked out here, you must first understand how the sandwich layers are determined. Temperature is measured with a thermometer. In the Arctic, the temperature of ocean water does not change very much, ranging from -1C to 5C, depending on location and time of year.
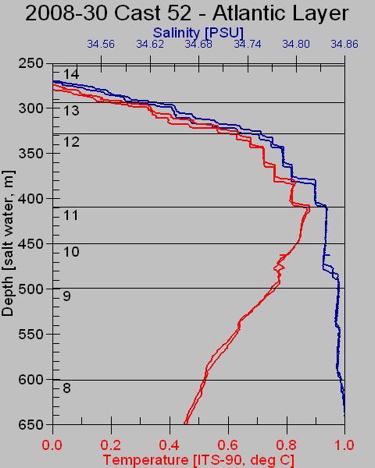
Depth is calculated by measuring hydrostatic pressure. See Dispatch # 20, August 5 2008 for an explanation of hydrostatic pressure (and its effect on Styrofoam cups). Hydrostatic pressure increases in a very predictable way as depth increases and the pressure sensor has been very finely calibrated to correspond to a specific depth. Conductivity is used to determine the salinity by measuring how much electricity can be conducted in a particular sample of ocean water. Ocean water is, on average, 35 parts per thousand (ppt) salt, primarily NaCl (sodium chloride, table salt). Na+Cl- is an ion, meaning that it can accept electrons. Electricity is the flow of electrons so the more salt in the water, the greater electric current it can conduct. As with pressure and depth, conductivity and salinity are very finely calibrated. (FYI: the units of conductivity are mho= 1/ohm) A typical CTD profile looks like this.
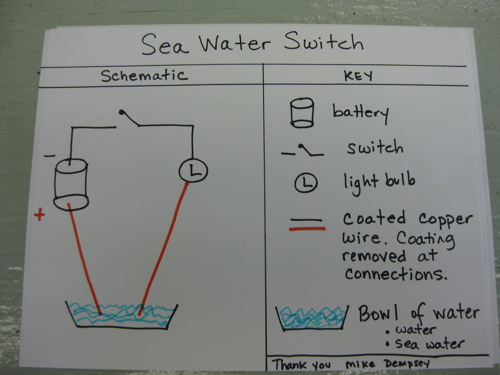
This partial scan shows how temperature and salinity change with water depth. As the depth increases (moving down on the vertical axis), temperature (in red) increases, until a maximum is reached at a depth of 400 meters. Then temperature slowly decreases as depth increases. Salinity, shown in blue, increases rapidly with depth, until about 400 meters deep, where it increases only very slowly to about 35 PSU (practical salinity units; 35PSU = 35 ppt). Note that the differences being measured here are very small 0.1 degrees C and 0.01 ppt. The "ocean water sandwich" layers can be defined by temperature and salinity. For example, the sample from Niskin bottle #14 from about 330 to 400 meters depth contains the warmest water. But wait --isn't warm water less dense than cold water. Why isn't this water up near the surface? Yes, warm water is less dense but this water also has relatively high salinity (note values of blue trace in this sample), which makes this water more dense that the colder water above. This profile nicely illustrates that, in the Arctic, salinity is a primary determiner of water density, of the layers in our ocean water sandwich. Certain types of water have certain salinity and temperature signatures and as the layers are identified, so is their source. In this way, specific types of water can be followed as it moves around in the Beaufort Sea. It seems a bit strange to calculate salinity by measuring conductivity! Here is a simple test you can do at home to test whether sea water conducts electricity. All equipment here can be found around the house or purchased at a local hardware store. Experiment to try at home: Sea Water Switch Purpose of experiment: The purpose of this experiment is to determine whether sea-water conducts electricity.
Materials: Procedure: Questions: Last updated: October 7, 2019 | |||||||||||||||||||||||||
Copyright ©2007 Woods Hole Oceanographic Institution, All Rights Reserved, Privacy Policy. | |||||||||||||||||||||||||