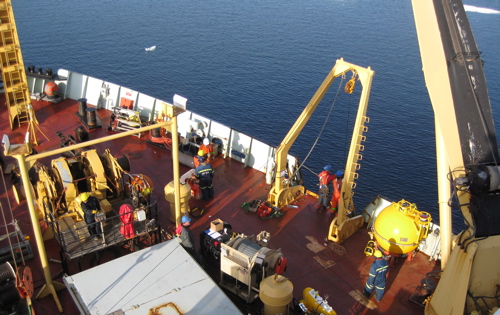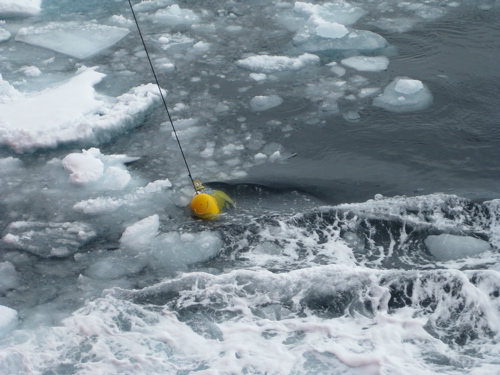

Gerty WardAugust 14, 2008This morning is sunny and COLD. The WHOI mooring team is deploying its last mooring.
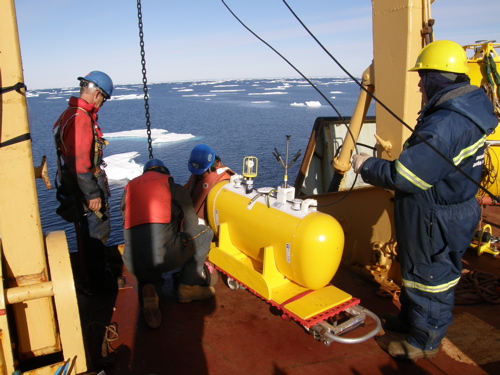
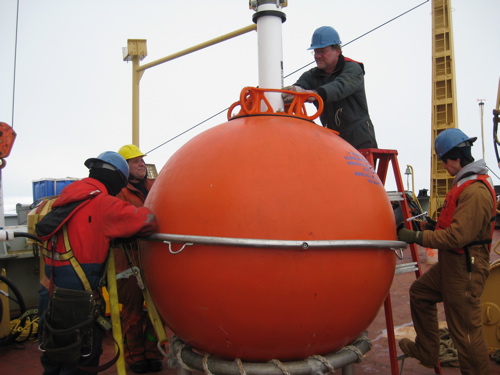
The key instrument on the mooring is the McLane Moored Profiler (MMP). This alien-looking device spends the year in the cold, cold Arctic waters, traveling up and down over 2000 meters of the water column. The MMP has several sensors that measure or calculate the big three in oceanography: conductivity, temperature and depth (please see Dispatch #26 for a complete CTD discussion). The MMP also measures water velocity using a doppler system housed in the 3-pronged black sensor located in its back. The top float is moored 40 meters below the surface so that ice ridges, which can extend for many meters below, do not bump into the mooring. This depth is also an excellent spot to place an upward-looking sonar.
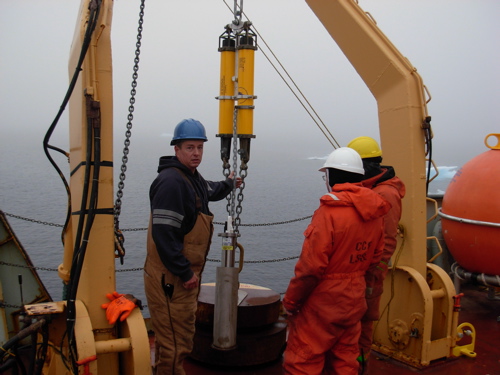
This sonar sends a signal upwards at regular intervals. By analyzing the time it takes to receive a reply, the amount and depth of the ice above can be calculated. Down near the bottom of the mooring, where the water temperature is a chilly -2C and there is no light and the hydrostatic pressure is tremendous, the mooring has a bottom-pressure sensor. This device measures the height of the water column above. These data give a picture of sea state - the height and frequency of waves as well as ice mass. These data give a picture of the water column in a particular location over time and are critical to our understanding of Arctic change: by taking measurements at the same place over a period of several years, scientists can begin to establish cause-and-effect relationships between observed factors. For example, the WHOI BGEP is finding that the Arctic freshwater layer is increasing. (Please see the August 12th Journal) and the BGEP cruise data page for more information). The first conclusion that one might draw is: the freshwater layer is increasing because the sea ice is melting. The situation is far more complex than that simple relationship, however. Precipitation, rivers, Pacific water intrusions all have an impact upon the freshwater content as well. Pacific water is considered a freshwater source because its salinity is consistently lower than Arctic water salinity. To truly understand a system as complex as the Beaufort Gyre, it is critical to develop techniques and instruments that can accurately measure these factors over time. The backbone of scientific inquiry is data collection! Without it, a hypothesis remains just a speculation.
Given the importance of data, it is critical that the MMP be brought on board! This can be really tricky in the ice conditions of the Arctic. This is why we are here. Last updated: October 7, 2019 | |||||||||||||||||||||||||
Copyright ©2007 Woods Hole Oceanographic Institution, All Rights Reserved, Privacy Policy. | |||||||||||||||||||||||||