Please note: You are viewing
the unstyled version of this website. Either your browser does not support CSS
(cascading style sheets) or it has been disabled. Skip
navigation.

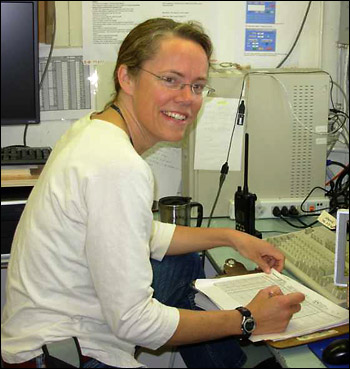
Sarah Zimmermann (IOS), Chief ScientistAugust 21, 2006
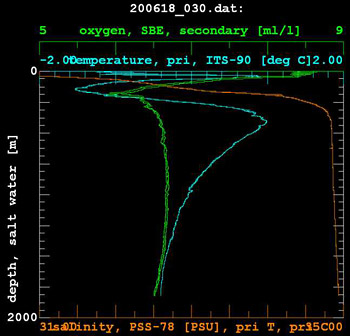
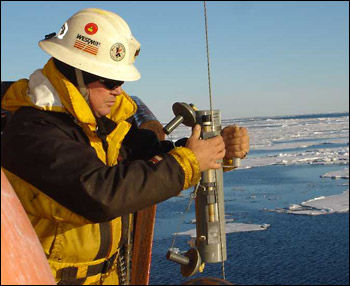
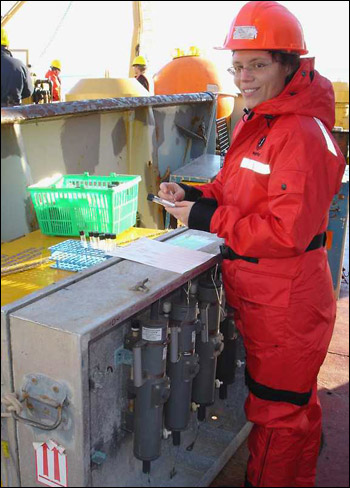
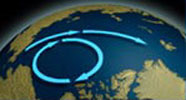
The CTD, an instrument named after the three primary measurements it collects (Conductivity, Temperature and Depth) is the backbone of all the seawater measurements. From these properties we calculate salinity (or roughly the amount of salt in the water) and density which can then be used to calculate the water’s movement. The measurements are taken continuously as the CTD is lowered from the surface to just a few meters above the ocean floor, so we have a very good picture of what the entire water column looks like. The 24 Niskin bottles on the rosette are sent down open, and are closed on the way back up, one at a time, each at a different depth, trapping 10L of water in each bottle. We analyze the water in the Niskins back in the lab for all sorts of properties. Beneath the surface, the conservative water properties like temperature and salinity, can only change by mixing or diffusion. This allows us to track the path of water by following its unique signature of temperature, salinity, and other geochemical properties. Non-conservative properties tell us about processes occurring in the water. For example, growing phytoplankton add oxygen and use nutrients whereas decomposing materials use oxygen but release nutrients into the water. What water masses are we focusing on in the Arctic? Looking at temperature you can easily see that water has come from the Pacific through the shallow Bering Strait. Near the surface is the warm summer water and below this is the denser (colder and saltier) winter water. Beneath the waters from the Pacific, we see the temperature rise again. This water has come all the way from the Atlantic traveling counterclockwise around the Arctic to our area of study. Warmer water is lighter than cold water so it is curious to see this temperature increase below the cold Pacific water. This increase is small though, less than 3 °C (about 5 °F), but salinity increases quite a lot. In the Arctic, density is controlled primarily by salinity. Versatility is important when you are out in the field. You just never know what may happen so it is good to bring out tools and spares just in case… We use the rosette for the water measurements but if we can’t use this system we have a backup. Today we have been using our backup, a different CTD that records its data internally. This means we can hang this CTD off any wire or rope anywhere on the ship unlike the primary system that needs to be lowered using the one winch with conducting wire (for power and data). We’ve been using the internally recording CTD from the foredeck and instead of a rosette full of Niskin bottles, Hugh MacLean (IOS) attaches single bottles to the wire. A weight, called a messenger, is hooked onto each bottle as its put on the wire. When the CTD has been lowered to its deepest point, Hugh attaches one last messenger to the wire and lets it go. It runs down the wire until it bangs into the first bottle, pushing a pin that releases the spring loaded bottle caps, closing the bottle. Besides the bottle caps, it also releases the messenger that was hooked onto that bottle, allowing it to fall to the next bottle, continuing the domino effect of closing all the bottles. This clever system allows all the bottles to be closed using only standard wire. This is the way all water used to be collected before the current combination of the conducting wire, electronic water sampler and computer. Last updated: October 7, 2019 | |||||||||||||||||||||||
Copyright ©2007 Woods Hole Oceanographic Institution, All Rights Reserved, Privacy Policy. | |||||||||||||||||||||||